
Decoding the Distinctions: UV vs. IR Spectroscopy
Introduction
Spectroscopy is a powerful analytical technique that involves the study of the interaction between light and matter. It has found wide-ranging applications in various fields, including chemistry, physics, biochemistry, and materials science, among others. Two commonly used spectroscopic techniques are UV (Ultraviolet) and IR (Infrared) spectroscopy, which provide valuable insights into the properties of molecules and materials.
In this topic of discussion, we will delve into the world of UV and IR spectroscopy, exploring their similarities and differences, and shedding light on their unique features. We will cover the fundamental principles, instrumentation, applications, and limitations of each technique, providing a comprehensive understanding of their strengths and weaknesses. So, let’s embark on this journey of unraveling the mystery of UV and IR spectroscopy.
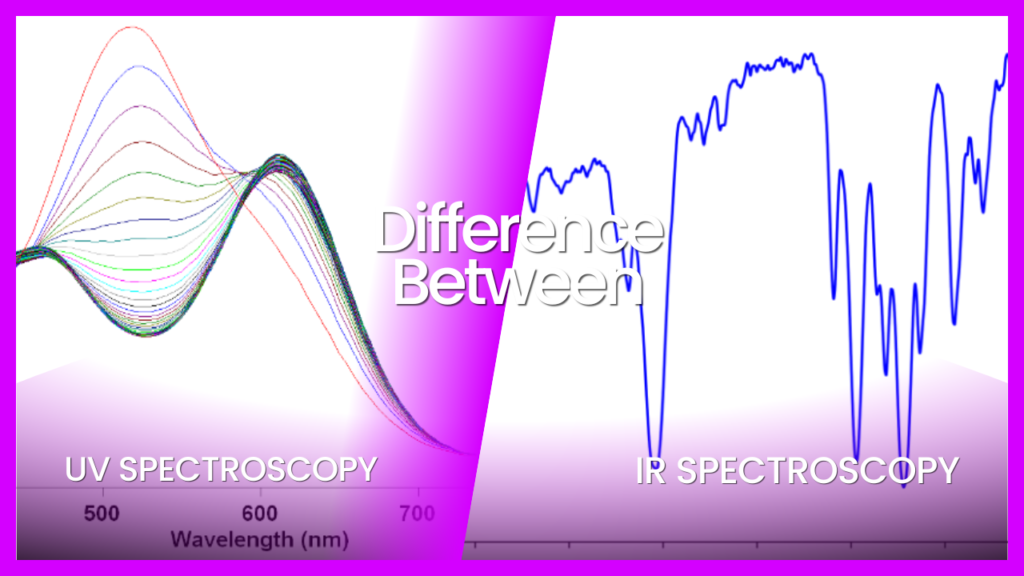
Basic Difference Between UV and IR spectroscopy
| Aspect | UV Spectroscopy | IR Spectroscopy |
|---|---|---|
| Principle | Absorption of UV light by molecules | Absorption of IR light by molecules |
| Wavelength range | 190-400 nm | 400-4000 cm^-1 |
| Type of radiation | Ultraviolet | Infrared |
| Molecular information | Electronic transitions and chromophores | Vibrational modes and functional groups |
| Instrumentation | UV-Visible spectrophotometer | Fourier Transform Infrared (FTIR) spectrometer |
| Sample requirements | Transparent to UV light, low concentration | Any sample state (solid, liquid, gas) and high concentration |
| Applications | Analysis of conjugated compounds, pharmaceuticals, environmental analysis, forensic science | Identification of functional groups, characterization of polymers, drug discovery, material analysis |
| Advantages | High sensitivity, rapid analysis, quantitative measurement | Structural information, identification of functional groups, non-destructive analysis |
| Limitations | Limited information about molecular structure, sample transparency requirements | Sensitivity to sample preparation, interference from water vapor, limited quantitative analysis |
| Future developments | Advancements in detector technology, improved resolution, integration with other techniques | Enhanced sensitivity, miniaturization of instruments, expanded applications through coupling with other techniques |
Basics of UV Spectroscopy
UV spectroscopy, or ultraviolet spectroscopy, is a technique used to study the interaction of ultraviolet (UV) radiation with matter. It is widely used in analytical chemistry, biochemistry, pharmaceuticals, and other fields to determine the concentration, structure, and properties of molecules. Here are some basics of UV spectroscopy:
Principle
UV spectroscopy is based on the absorption of UV radiation by molecules. When a sample is exposed to UV radiation, some of the molecules in the sample absorb the energy from the UV radiation and undergo electronic transitions, moving from a lower energy state to a higher energy state. The energy absorbed corresponds to the energy difference between the two states and is characteristic of the chemical structure of the molecule.
Instrumentation
A typical UV spectrophotometer consists of a UV light source that emits UV radiation, a monochromator that selects a specific wavelength of UV radiation, a sample cell or cuvette that holds the sample, and a detector that measures the intensity of the transmitted or absorbed radiation. The output is displayed as a UV spectrum, which is a plot of the absorbance or transmittance of the sample as a function of wavelength.
Absorption spectrum
The absorption spectrum is the plot of absorbance (or the negative logarithm of transmittance) versus wavelength. It provides information about the wavelengths of UV radiation that are absorbed by the sample, which in turn gives insights into the electronic structure and chemical properties of the molecules in the sample. Absorption peaks in the UV spectrum are often used for qualitative and quantitative analysis of the sample.
Chromophores
Chromophores are the chemical groups in molecules that are responsible for UV absorption. They are typically composed of conjugated double bonds or aromatic rings, which can undergo electronic transitions upon UV radiation exposure. Different chromophores absorb UV radiation at different wavelengths, allowing for identification and characterization of different types of molecules.
Beer’s Law
Beer’s Law is a fundamental principle in UV spectroscopy that describes the relationship between the absorbance of a sample and its concentration. According to Beer’s Law, the absorbance of a sample is directly proportional to the concentration of the absorbing species and the path length of the sample cell. It is commonly used for quantitative analysis in UV spectroscopy.
Applications
UV spectroscopy has a wide range of applications in various fields. It is used for quantitative analysis of substances such as pharmaceuticals, environmental pollutants, and biochemicals. It is also used for structural analysis of organic molecules, determining the presence of functional groups, and monitoring chemical reactions. UV spectroscopy is also used in the study of biological molecules like proteins, nucleic acids, and enzymes to understand their structure and function.
Limitations
UV spectroscopy has some limitations. It is primarily applicable to compounds that absorb UV radiation, which means it may not be suitable for molecules that lack appropriate chromophores. Additionally, UV spectroscopy can be sensitive to impurities in the sample, and the presence of other absorbing species can interfere with the measurement. Sample preparation, instrument calibration, and data analysis are critical for obtaining accurate and reliable results in UV spectroscopy.
Fundamentals of IR Spectroscopy
Infrared (IR) spectroscopy is a widely used technique in analytical chemistry that involves the study of the interaction of infrared radiation with matter. It is used to identify and characterize chemical compounds based on their vibrational and rotational modes of motion. Here are the fundamentals of IR spectroscopy in detail:
Principle
IR spectroscopy is based on the principle that molecules absorb infrared radiation in the form of photons, which causes changes in the vibrational and rotational energy levels of the molecule. When IR radiation passes through a sample, some of the wavelengths are absorbed by the sample, while others are transmitted. The absorbed wavelengths correspond to the vibrational frequencies of the chemical bonds in the sample, and by measuring these frequencies, information about the molecular structure and functional groups can be obtained.
Instrumentation:
A typical IR spectrophotometer consists of an IR light source that emits IR radiation, an interferometer that modulates the IR radiation, a sample compartment that holds the sample, and a detector that measures the intensity of the transmitted or absorbed radiation. The output is displayed as an IR spectrum, which is a plot of the transmittance or absorbance of the sample as a function of wavenumber or wavelength.
IR Spectral Range
IR radiation is divided into three regions based on wavelength: near-infrared (NIR), mid-infrared (MIR), and far-infrared (FIR). The NIR region ranges from 780 nm to 2500 nm, the MIR region ranges from 2500 nm to 25 μm, and the FIR region ranges from 25 μm to 1000 μm. Different regions are used for different types of analyses and have different applications.
Functional Groups
In IR spectroscopy, different functional groups in a molecule absorb IR radiation at characteristic frequencies, leading to the formation of characteristic peaks in the IR spectrum. These peaks are used to identify and characterize the presence of specific functional groups, such as carbonyl (C=O), hydroxyl (O-H), amino (N-H), and others. The position, intensity, and shape of these peaks provide valuable information about the molecular structure and chemical properties of the sample.
IR Spectra Interpretation
Interpreting an IR spectrum involves identifying and assigning the peaks to specific functional groups or vibrational modes. This is done by comparing the peaks observed in the sample spectrum with known spectra of reference compounds or using spectral databases. Factors such as peak position, intensity, and shape, as well as the presence or absence of certain peaks, are taken into consideration to determine the molecular structure of the sample.
Sample Preparation
Sample preparation is an important aspect of IR spectroscopy. The sample must be prepared as a thin, transparent film or a finely ground powder to ensure that the IR radiation can pass through the sample and be absorbed by the molecules. Common methods of sample preparation include making KBr pellets, mulling with a suitable solvent, or using attenuated total reflectance (ATR) techniques, where the sample is placed directly on an ATR crystal.
Quantitative Analysis
IR spectroscopy can also be used for quantitative analysis. This involves measuring the absorbance or transmittance of a sample at a specific frequency and relating it to the concentration of the analyte of interest using calibration curves or other quantitative methods. However, quantitative analysis in IR spectroscopy can be complicated by factors such as sample matrix effects, overlapping peaks, and instrument calibration.
Applications
IR spectroscopy finds a wide range of applications in various fields, including pharmaceuticals, chemicals, polymers, food and beverages, forensic science, environmental science, and materials science. It is used for qualitative and quantitative analysis, identification and characterization of unknown compounds, monitoring chemical reactions, studying molecular structure and conformation, and other purposes.
Limitations
IR spectroscopy also has some limitations, including:
- Limited sensitivity: IR spectroscopy may not be sensitive enough for detecting low concentration analytes, as the IR radiation is absorbed by the sample in a non-selective manner, including the solvent and sample matrix.
- Overlapping peaks: IR spectra can sometimes have overlapping peaks, making it challenging to accurately assign and interpret peaks corresponding to specific functional groups or vibrational modes.
- Water interference: Water molecules strongly absorb IR radiation in certain frequency ranges, which can interfere with the analysis of samples with high water content, such as aqueous solutions or biological samples.
- Sample preparation: Sample preparation can be time-consuming and may require careful handling to ensure that the sample is properly prepared as a thin, transparent film or finely ground powder, which can affect the reproducibility of results.
- Lack of structural information: While IR spectroscopy provides valuable information about functional groups and molecular vibrations, it does not provide detailed structural information about the arrangement of atoms within a molecule, which may require complementary techniques such as X-ray diffraction or NMR spectroscopy.
- Instrumentation complexity: IR spectrophotometers can be complex and require regular calibration and maintenance to ensure accurate and reliable results.
Despite these limitations, IR spectroscopy is a powerful analytical technique that is widely used in various fields for identifying and characterizing chemical compounds based on their vibrational and rotational motions. Proper sample preparation, spectral interpretation, and understanding of the limitations are crucial for obtaining reliable results in IR spectroscopic analysis.
Conclusion
In conclusion, UV and IR spectroscopy are two distinct techniques used in the field of spectroscopy for studying the properties of molecules. UV spectroscopy is based on the absorption of UV radiation by molecules, primarily focusing on electronic transitions and providing information about electronic structure and conjugated systems. On the other hand, IR spectroscopy is based on the absorption of IR radiation by molecules, primarily focusing on molecular vibrations and providing information about functional groups, molecular structure, and polymer analysis.
Both UV and IR spectroscopy have their strengths and limitations, making them suitable for different applications. UV spectroscopy is commonly used in the analysis of organic compounds, environmental analysis, and pharmaceuticals, while IR spectroscopy is widely used in the identification of functional groups, determination of molecular structure, and analysis of polymers, among other applications. Understanding the principles, instrumentation, applications, and limitations of both techniques can help researchers choose the most appropriate method for their specific analytical needs.
In conclusion, UV and IR spectroscopy are powerful techniques that play crucial roles in the field of analytical chemistry. While they share some similarities in terms of being spectroscopic methods that involve the absorption of radiation, they differ significantly in their principles, instrumentation, applications, and limitations. UV spectroscopy focuses on electronic transitions and is widely used in the analysis of organic compounds, while IR spectroscopy focuses on molecular vibrations and is commonly used for the identification of functional groups, determination of molecular structure, and analysis of polymers. By understanding these differences, researchers can choose the appropriate technique for their specific analytical requirements.
To ensure accurate and reliable results, it is essential to carefully choose the appropriate spectroscopic technique based on the properties of the sample and the information required. Proper sample preparation, calibration, and data analysis are also crucial in both UV and IR spectroscopy to obtain meaningful results. It is also important to consider the limitations of each technique, such as the potential interference from impurities, overlapping bands, and sample concentration limitations.
Moreover, to obtain accurate and reliable results, it is crucial to properly calibrate and validate the UV and IR spectrometers, ensure appropriate sample handling and preparation techniques, and carefully analyze the obtained spectra. Additionally, it is important to consider the advantages and limitations of each technique and choose the most suitable one for the specific analytical requirements.
In terms of future developments, both UV and IR spectroscopy continue to evolve with advancements in technology. For instance, the development of more sensitive detectors and improved resolution in spectrometers has led to enhanced capabilities in terms of sensitivity, accuracy, and precision. Furthermore, the integration of UV and IR spectroscopy with other analytical techniques, such as chromatography and mass spectrometry, has led to more powerful and versatile analytical methods for complex sample analysis.
In conclusion, UV and IR spectroscopy are important tools in the field of analytical chemistry that provide valuable information about the properties of molecules. They have different principles, instrumentation, applications, and limitations, making them suitable for different analytical needs. By understanding these differences and utilizing the appropriate technique, researchers can obtain accurate and reliable results in various applications, ranging from pharmaceuticals and environmental analysis to materials science and forensics. Continued advancements in technology and integration with other analytical techniques will further enhance the capabilities of UV and IR spectroscopy, making them indispensable tools in modern analytical chemistry.
References
- Skoog, D. A., Holler, F. J., & Crouch, S. R. (2017). Principles of Instrumental Analysis. Cengage Learning.
- Silverstein, R. M., Webster, F. X., & Kiemle, D. J. (2014). Spectrometric Identification of Organic Compounds. Wiley.
- Griffiths, P., & de Haseth, J. A. (2007). Fourier Transform Infrared Spectrometry. John Wiley & Sons.
- Bhagavatula, M., & Bhattacharya, S. K. (2017). UV-visible Spectrophotometry: Advancements, Limitations and its Applications in Pharmaceutical Analysis. Pharmaceutics, 9(3), 30.
- Cole, T. M., & Lippa, K. A. (2012). Mid-Infrared Spectroscopy in Conservation: The Science and the Applications. The Metropolitan Museum of Art Bulletin, 69(4), 4-64.