What is UV Spectrophotometer
UV-Visible spectroscopy is a technique used to measure the absorbance of light in the ultraviolet (UV) and visible regions of the electromagnetic spectrum. This technique is commonly used in analytical chemistry, biochemistry, and materials science. The principle of UV-Visible spectroscopy is based on the interaction of light with matter. In this article, we will discuss the principle of UV-Visible spectroscopy in detail, including Beers-Lambert’s law, the components of a UV-Visible spectrophotometer, and applications of this technique.
Principle of UV Spectrophotometer
The principle of UV-Visible spectroscopy is based on the Beer-Lambert law, which states that the absorbance of light by a sample is proportional to its concentration and the path length of the sample. This law describes the relationship between the intensity of light transmitted through a sample and the concentration of the absorbing species in the sample.
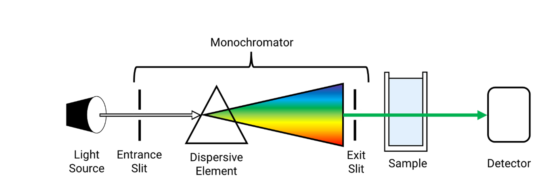
A UV-Visible spectrophotometer measures the absorbance of light by a sample in the UV or visible region of the electromagnetic spectrum. The spectrophotometer consists of a light source, monochromator, sample holder, detector, and data processing unit.
The light source emits light in the UV or visible region of the electromagnetic spectrum. The monochromator selects a specific wavelength of light from the source, which is then directed onto the sample holder. The sample holder holds the sample in place during the measurement. The detector measures the intensity of light transmitted through the sample, and the data processing unit calculates the absorbance of the sample using the Beer-Lambert law.
Beer-Lambert’s Law
The Beer-Lambert law, also known as the Beer-Lambert-Bouguer law, is a fundamental principle in the field of spectroscopy that describes the relationship between the absorbance of a sample and its concentration and path length.
The law states that the absorbance of a sample is directly proportional to its concentration and the path length of the light through the sample. Mathematically, the law is expressed as:
A = ɛlc
where A is the absorbance, ɛ is the molar extinction coefficient (a constant that depends on the identity of the sample and the wavelength of light used), l is the path length of the light through the sample, and c is the concentration of the sample in moles per liter.
The law assumes that the sample is homogeneous, meaning that its properties are uniform throughout the entire volume of the sample. It also assumes that the light passing through the sample is monochromatic, meaning that it consists of only one wavelength and that the sample is placed in a container with parallel walls so that the path length is constant throughout the sample.
The Beer-Lambert law is commonly used in UV-Visible spectroscopy, where it is used to determine the concentration of a sample by measuring its absorbance at a specific wavelength. A calibration curve can be generated by measuring the absorbance of a series of samples with known concentrations, and the concentration of an unknown sample can then be determined by measuring its absorbance and using the calibration curve to determine its concentration.
The Beer-Lambert law has several important implications for spectroscopic analysis. First, it implies that the absorbance of a sample is linearly proportional to its concentration over a certain range, known as the Beer’s law limit. Second, it implies that the absorbance of a sample is proportional to the path length of the light through the sample, which means that longer path lengths will result in higher absorbance values. Finally, it implies that the absorbance of a sample is proportional to the molar extinction coefficient, which means that samples with higher extinction coefficients will absorb more light at a given concentration and path length.
Components of a UV-Visible Spectrophotometer
The following are the components of a UV-Visible spectrophotometer:
- Light Source:
The light source emits light in the UV or visible region of the electromagnetic spectrum. The most commonly used light sources are deuterium lamps, which emit light in the UV region, and tungsten lamps, which emit light in the visible region.
- Monochromator:
The monochromator selects a specific wavelength of light from the source. It consists of a prism or a grating that separates the different wavelengths of light. The monochromator allows only a single wavelength of light to pass through to the sample holder.
- Sample Holder:
The sample holder holds the sample in place during the measurement. It is usually a quartz or glass cell that is transparent to the wavelength of light being used. The sample holder must be clean and free from scratches or other defects that may affect the measurement.
- Detector:
The detector measures the intensity of light transmitted through the sample. The most commonly used detector is a photodiode, which converts light into an electrical signal that is proportional to its intensity.
- Data Processing Unit:
The data processing unit calculates the absorbance of the sample using the Beer-Lambert law. It also displays the results and allows the user to store or export the data.
Applications of UV-Visible Spectroscopy
UV-Visible spectroscopy has a wide range of applications in analytical chemistry, biochemistry, and materials science. Some of the applications of UV-Visible spectroscopy are:
Quantitative Analysis
UV-Visible spectroscopy is used for the quantitative analysis of a wide range of compounds, including drugs, pesticides, and environmental pollutants. The absorbance of a sample is proportional to its concentration, which allows for the determination of the concentration of an unknown sample.
Qualitative Analysis
UV-Visible spectroscopy is also used for qualitative analysis to identify the presence of certain functional groups in a molecule. Different functional groups absorb light at different wavelengths, which allows for the identification of the presence of specific functional groups in a molecule.
Kinetic Studies
UV-Visible spectroscopy can be used to study the kinetics of chemical reactions. The absorbance of a sample changes over time as a reaction proceeds, which allows for the determination of reaction rates and the order of the reaction.
Protein and Nucleic Acid Analysis
UV-Visible spectroscopy is used to analyze proteins and nucleic acids. Proteins absorb light in the UV region, which allows for the determination of protein concentration and purity. Nucleic acids absorb light in the UV region due to the presence of aromatic bases, which allows for the determination of nucleic acid concentration and purity.
Materials Science
UV-Visible spectroscopy is used in materials science to study the electronic properties of materials. The electronic properties of materials, such as band gap energy and optical conductivity, can be determined by analyzing their absorbance spectra.
Advantages and Disadvantages of UV Spectrophotometry
UV spectroscopy, like any analytical technique, has its advantages and disadvantages. Some of the advantages and disadvantages of UV spectroscopy are listed below:
Advantages
- High sensitivity: UV spectroscopy is a highly sensitive technique that can detect even small quantities of a sample.
- Non-destructive: UV spectroscopy is a non-destructive technique that does not alter the sample being analyzed.
- Fast and easy to use: UV spectrophotometers are relatively easy to use and can provide results quickly, making them ideal for routine analysis.
- Wide range of applications: UV spectroscopy can be used for a wide range of applications, including quantitative and qualitative analysis, protein and nucleic acid analysis, kinetic studies, and materials science.
- Relatively low cost: UV spectrophotometers are relatively inexpensive compared to other analytical techniques.
Disadvantages
- Limited information: UV spectroscopy provides information about the absorbance of a sample at a specific wavelength, which may not be sufficient for complex samples.
- Interference from impurities: The presence of impurities in a sample can interfere with the accuracy of UV spectroscopic measurements.
- Limited range of analysis: UV spectroscopy is limited to the analysis of samples that absorb light in the UV region of the electromagnetic spectrum, which may not be suitable for all samples.
- Limited resolution: The resolution of UV spectroscopy is limited by the bandwidth of the light source and the monochromator, which may not be sufficient for complex samples.
- Limited sensitivity to some compounds: Some compounds, such as non-aromatic compounds, may not absorb UV light and therefore cannot be detected by UV spectroscopy.
UV spectroscopy is a useful analytical technique with several advantages and disadvantages. Its high sensitivity, non-destructive nature, ease of use, wide range of applications, and relatively low cost make it a popular choice for routine analysis. However, its limitations in terms of the information provided, interference from impurities, limited range of analysis, limited resolution, and limited sensitivity to some compounds should also be taken into consideration when using this technique.
FAQs about UV spectrophotometry
Q: What is UV spectrophotometry?
A: UV spectrophotometry is an analytical technique that uses ultraviolet (UV) light to measure the absorbance of a sample at a specific wavelength. The technique is commonly used to determine the concentration of a sample in solution.
Q: What is the principle of UV spectrophotometry?
A: The principle of UV spectrophotometry is based on the Beer-Lambert law, which states that the absorbance of a sample is directly proportional to its concentration and the path length of the light through the sample. The law is used to determine the concentration of a sample by measuring its absorbance at a specific wavelength.
Q: What is the range of wavelengths used in UV spectrophotometry?
A: The range of wavelengths used in UV spectrophotometry is typically between 190 and 400 nanometers (nm).
Q: What types of samples can be analyzed by UV spectrophotometry?
A: UV spectrophotometry can be used to analyze a wide range of samples, including organic and inorganic compounds, proteins, nucleic acids, and polymers.
Q: What is a blank in UV spectrophotometry?
A: A blank is a sample that contains all of the components of the sample being analyzed, except for the analyte of interest. Blanks are used to correct for any background absorbance or interference from other components in the sample.
Q: How is a calibration curve generated in UV spectrophotometry?
A: A calibration curve is generated by measuring the absorbance of a series of standards with known concentrations of the analyte of interest. The absorbance values are then plotted against the concentrations to generate a linear curve, which can be used to determine the concentration of an unknown sample.
Q: What are some sources of error in UV spectrophotometry?
A: Some sources of error in UV spectrophotometry include instrumental drift, improper sample preparation, interference from impurities or other components in the sample, and inaccurate calibration of the instrument.
Q: What are some common applications of UV spectrophotometry?
A: Some common applications of UV spectrophotometry include quantitative and qualitative analysis of samples, protein and nucleic acid analysis, kinetic studies, and materials science.